-
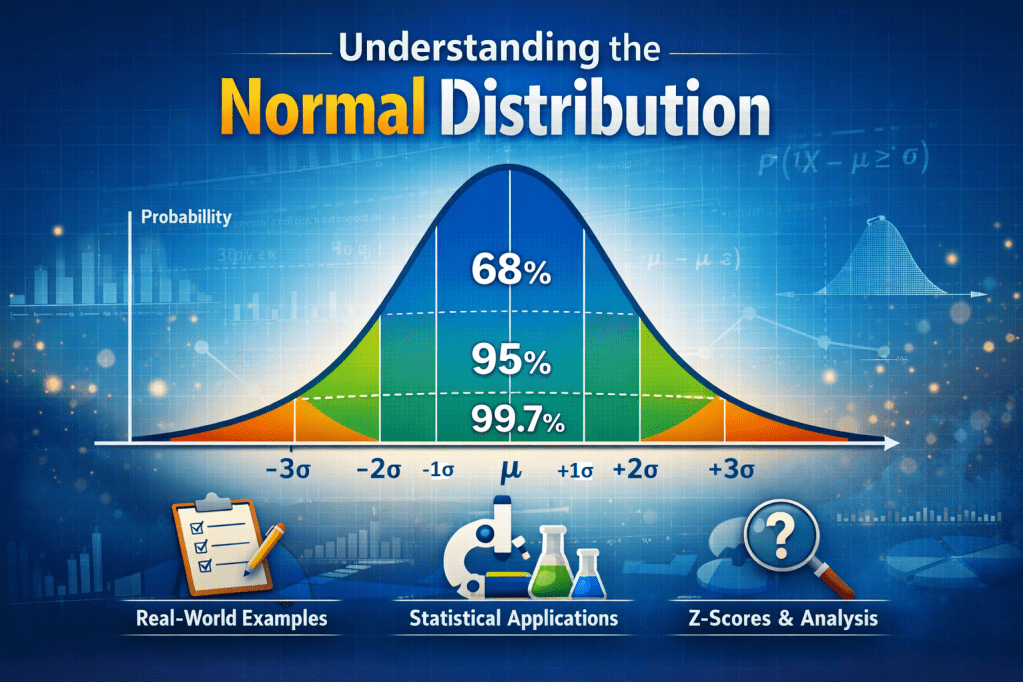 Continue reading →: 📊 Normal Distribution: Concepts, Properties, Applications & Examples
1. Introduction In statistics, one of the most important and widely used concepts is the normal distribution, also known as the Gaussian distribution. It plays a central role in data analysis, probability theory, and inferential statistics because many real-world phenomena approximately follow this distribution. From students’ test scores to measurement…
-
 Continue reading →: Model Development Document (MDD) in Financial Model Risk Management (MRM)
Introduction In modern financial institutions, quantitative models drive critical decisions—from credit approvals to market risk assessment and fraud detection. However, with increasing reliance on models comes model risk—the risk of incorrect decisions due to flawed or misused models. To mitigate this, organizations implement Model Risk Management (MRM) frameworks. A key…
-
 Continue reading →: Model Validation Report (MVR) in Financial Model Risk Management (MRM)
Introduction As financial institutions increasingly rely on quantitative models for decision-making, the importance of independent model validation has grown significantly. Even a well-developed model can fail if not properly validated. This is where the Model Validation Report (MVR) plays a crucial role. It provides an independent assessment of whether a…
-
 Continue reading →: 📊 Statistical Tests Explained: How to Choose the Right Test?
Statistical analysis can feel overwhelming—especially when you’re faced with choosing the right test for your data. Should you use a t-test? ANOVA? Chi-square? This guide breaks everything down in a simple, practical way using real-world examples and clear decision rules. 🔍 What is a P-value? A P-value helps you determine…
-
 Continue reading →: 🔬 Research Methodology: A systematic roadmap for scientific inquiry
🌟 Introduction Research is not just about collecting data or running statistical tests. It is about systematically answering a question using structured reasoning, evidence, and appropriate methods. Whether in: A well-designed research methodology ensures that findings are: In simple terms: Research methodology is the blueprint of a research study. Research…
-
 Continue reading →: Credit Analytics in Agriculture: From Appraisal to Credit Scoring
A Practical, Data-Driven Perspective Agricultural lending is fundamentally different from retail or corporate lending. Unlike salaried borrowers or large firms, farmers and Farmer Producer Organizations (FPOs) operate under high uncertainty—weather shocks, price volatility, biological risks, and policy interventions. This article explains four core pillars of agricultural credit analytics using realistic…
-
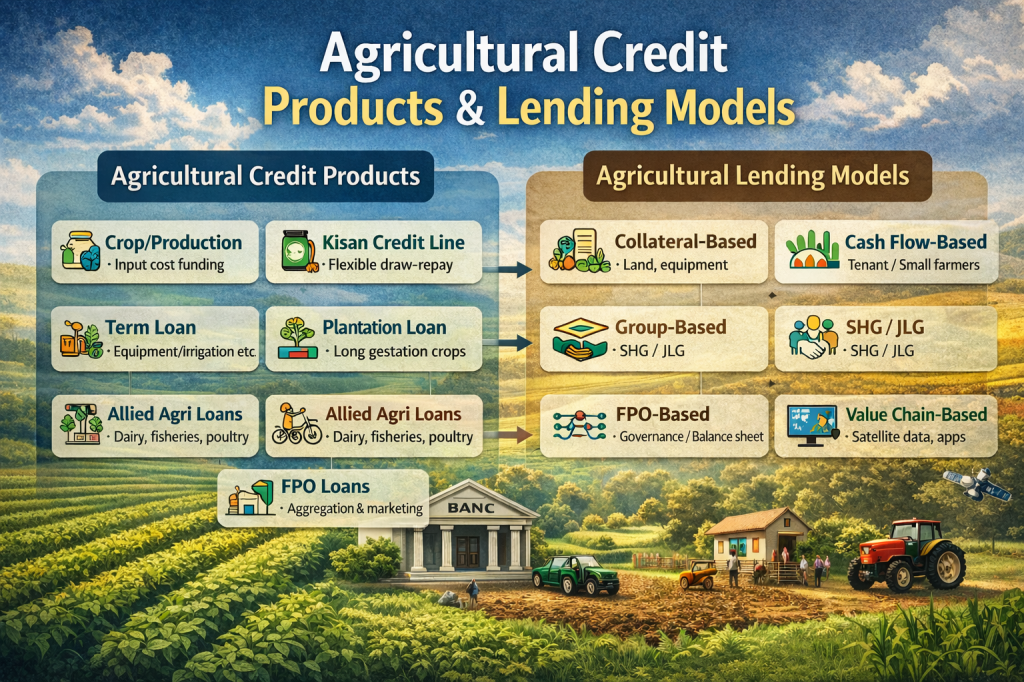 Continue reading →: 🌾 Agricultural Credit Products & Lending Models
(How money actually flows to farmers, FPOs & agri-ecosystems) 1️⃣ Agricultural Credit Products 👉 “What type of loan is given?” 🔹 A. Crop / Production Loans (Short-term) Purpose Key characteristics Analytics angle 📌 Most common agri loan in India 🔹 B. Kisan Credit Line–Type Revolving Credit Purpose Key characteristics Analytics…
-
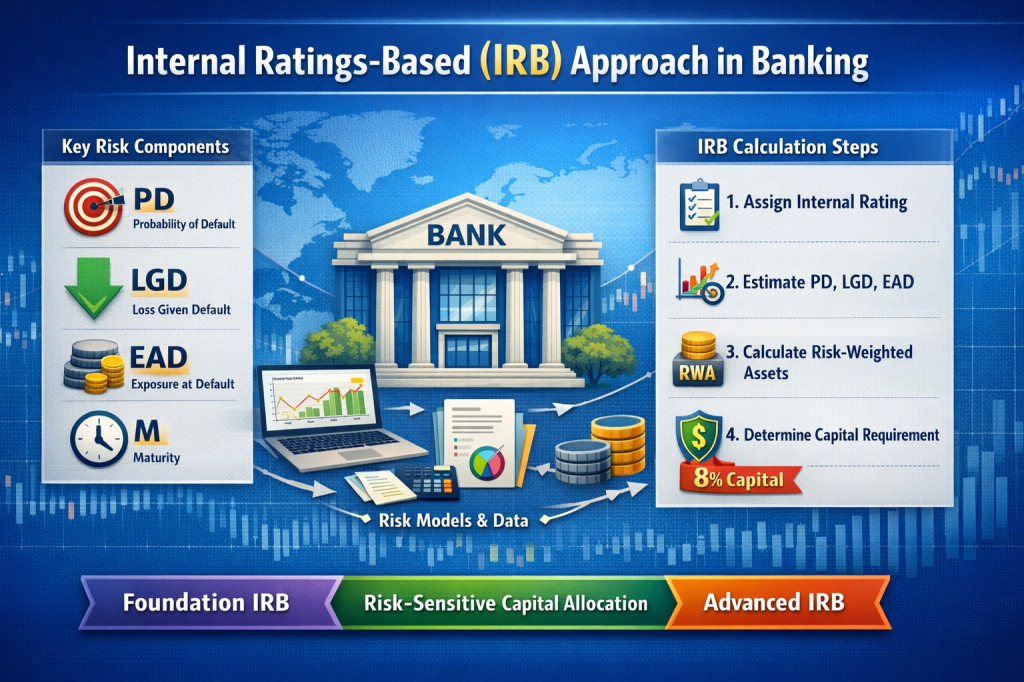 Continue reading →: 🏦 Internal Ratings-Based (IRB) Approach in Banking
Advanced credit risk measurement under Basel norms 🌟 Introduction Credit risk—the risk that borrowers may fail to meet their obligations—is the largest risk faced by banks. To ensure banks hold sufficient capital against credit risk, global regulators introduced standardized and advanced risk measurement frameworks under the Basel Accords. One of…
-
 Continue reading →: 🔍 Clustering Machine Learning Models
🌟 Introduction In many real-world problems, labels are not available. We may not know in advance: This is where clustering comes in. Clustering is an unsupervised machine learning technique that groups data points such that: Clustering is widely used in marketing, finance, healthcare, agriculture, image processing, and anomaly detection. 📌…
-
 Continue reading →: 🤖 Logistic Regression and Support Vector Machine (SVM)
🌟 Introduction Classification problems are everywhere: Two of the most important and widely used algorithms for such tasks are: Though very different in philosophy, both are core supervised learning models and often serve as baseline and benchmark models in real projects. 🔵 Logistic Regression 📌 What is Logistic Regression? Logistic…
-
 Continue reading →: 🌳 Decision Tree and Random Forest Machine Learning Models
🌟 Introduction Among supervised machine learning algorithms, Decision Trees and Random Forests are widely used because they balance interpretability, flexibility, and strong performance. They are extensively used in finance, healthcare, retail, agriculture, and fraud detection, making them must-know models for any analytics professional. 🌳 Decision Tree Model 📌 What is…
-
 Continue reading →: 📊 Performance Evaluation Metrics for Machine Learning Models
🌟 Introduction Building a machine learning model is only half the job. The real challenge lies in evaluating how well the model performs and whether it can be trusted for real-world decision-making. Performance evaluation metrics help us: Since regression and classification problems are fundamentally different, their evaluation metrics also differ.…
-
 Continue reading →: 🤖 Regression and Classification Machine Learning Models: Concepts, Examples, and Use Cases
🌟 Introduction Machine Learning (ML) has become a core component of modern analytics, powering applications such as demand forecasting, fraud detection, medical diagnosis, recommendation systems, and image recognition.At a high level, supervised machine learning models are broadly classified into: Understanding the difference between these two, their algorithms, and use cases…
-
 Continue reading →: 🍽️ Food Analytics: How Data Is Transforming the Global Food System
🌟 Introduction The food industry is undergoing a massive digital transformation. With rising consumer expectations, supply chain disruptions, climate variability, and food safety challenges, organizations increasingly rely on Food Analytics to make smarter, faster, and safer decisions. Food Analytics integrates data science, AI, IoT, and statistical modeling to improve production,…
-
 Continue reading →: 📘 Linear Programming: A Guide with Solved Examples
🌟 Introduction In business, supply chains, finance, manufacturing, agriculture, transport, and even daily planning, we constantly face situations where resources are limited. Linear Programming (LP) is one of the most powerful mathematical tools to allocate scarce resources optimally. From choosing the best product mix, minimizing transportation costs, or optimizing crop…
-
 Continue reading →: 🧩 Data Systems: The Backbone of the Digital World
🌟 Introduction In the era of data-driven decision-making, every click, transaction, and sensor reading generates massive amounts of data. But this data has little value unless it’s collected, stored, managed, and processed efficiently — and that’s exactly what Data Systems are designed to do. From the apps on your phone…
-
 Continue reading →: 🧭 Prescriptive Analytics: The Science of Making Optimal Decisions
🌟 Introduction In the world of data-driven decision-making, analytics has evolved through three major stages: While descriptive and predictive analytics tell us about past and future, prescriptive analytics takes things a step further — it tells us the best possible action to achieve a desired outcome. In simple terms, prescriptive…
-
 Continue reading →: 📊 Understanding Skewness and Kurtosis: Shape of a Data Distribution
When we describe data using mean, median, mode, and standard deviation, we understand its center and spread.But to truly grasp how data behaves, we must also understand its shape — that’s where Skewness and Kurtosis come in. Let’s explore what they mean, how to calculate them, and how to interpret…
-
 Continue reading →: 📉 Understanding Linear Regression: The Foundation of Predictive Analytics
🌟 Introduction In today’s data-driven world, predictive analytics plays a central role in decision-making — from forecasting sales to estimating crop yield, predicting house prices, or determining customer churn.At the core of these predictive models lies one of the simplest yet most powerful statistical tools: Linear Regression. 🔍 What is…
-
 Continue reading →: 📈 Understanding Correlation: Measuring the Strength of Relationships Between Variables
In the world of data and analytics, understanding how two variables move together is fundamental.For example — These relationships are captured by a powerful statistical concept called Correlation. 🔍 What is Correlation? Correlation measures the strength and direction of a linear relationship between two variables. In simple terms: Correlation tells…
Hello,
It’s time2analytics
Welcome to time2analytics.com, your one-stop destination for exploring the fascinating world of analytics, technology, and statistical techniques. Whether you’re a data enthusiast, professional, or curious learner, this blog offers practical insights, trends, and tools to simplify complex concepts and turn data into actionable knowledge. Join us to stay ahead in the ever-evolving landscape of analytics and technology, where every post empowers you to think critically, act decisively, and innovate confidently. The future of decision-making starts here—let’s embrace it together!
Let’s connect
Join the fun!
Stay updated with our latest tutorials and ideas by joining our newsletter.
